Dashboard
Captain CDN Dashboard displays statistics about your distribution. You can see charts for specific dates about total bytes and total requests that were served from CDN edge servers.stiv
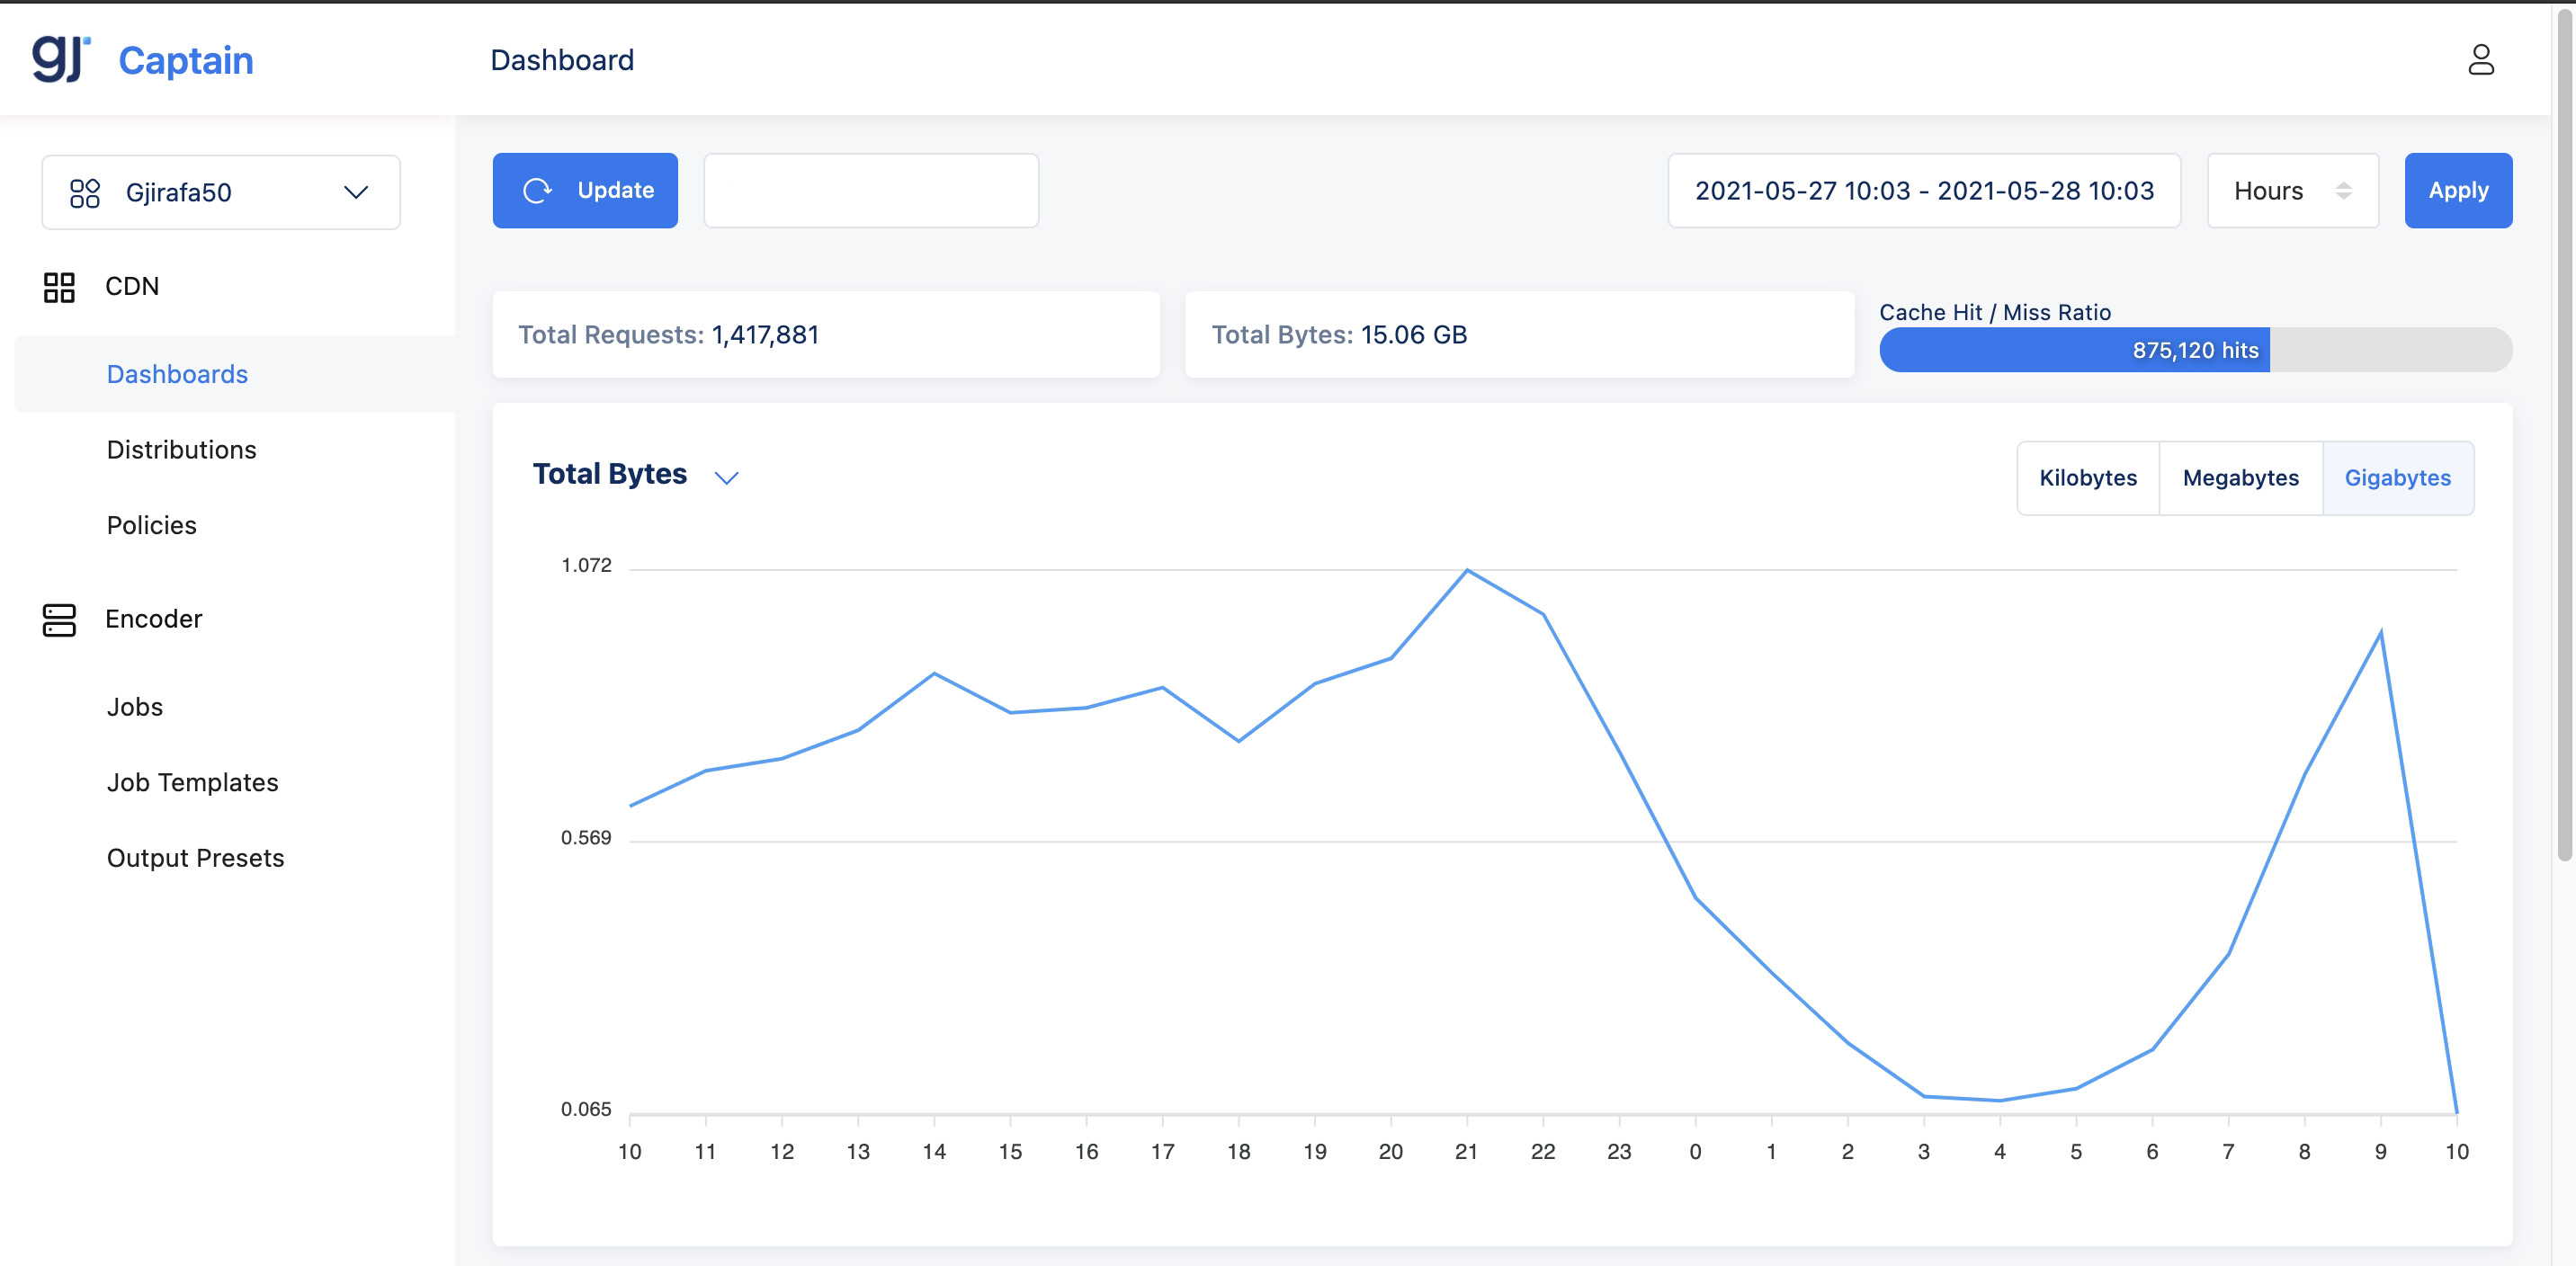
Total Requests - shows the number of the total requests that were served by Captain CDN edge servers in a given period of time.
Total Bytes - shows the total number of bytes served by CDN for a given distribution.
Total Bytes/Total Request - Graph Chart shows the total number of requests for all HTTP status codes (for example, 200 or 404) and all methods (for example, GET, HEAD, or POST). You can easily switch from Total Requests to Total Bytes and see the chart for the total bytes served by Captain CDN edge servers for a given period.
Cache Hit/Miss Ratio - this graph shows hits, misses, and errors as a percentage of total viewer requests for the selected CDN distribution:
Hit - a viewer request for which the object is served from a CDN edge cache.
Miss - a viewer request for which the object isn't currently in an edge cache, so CDN must get the object from your origin.
Referrers - the chart displays a list of the domains of the websites that originated the most HTTP and HTTPS requests for objects that CDN is distributing for a specified distribution. These top referrers can be search engines, other websites that link directly to your objects, or your own website.
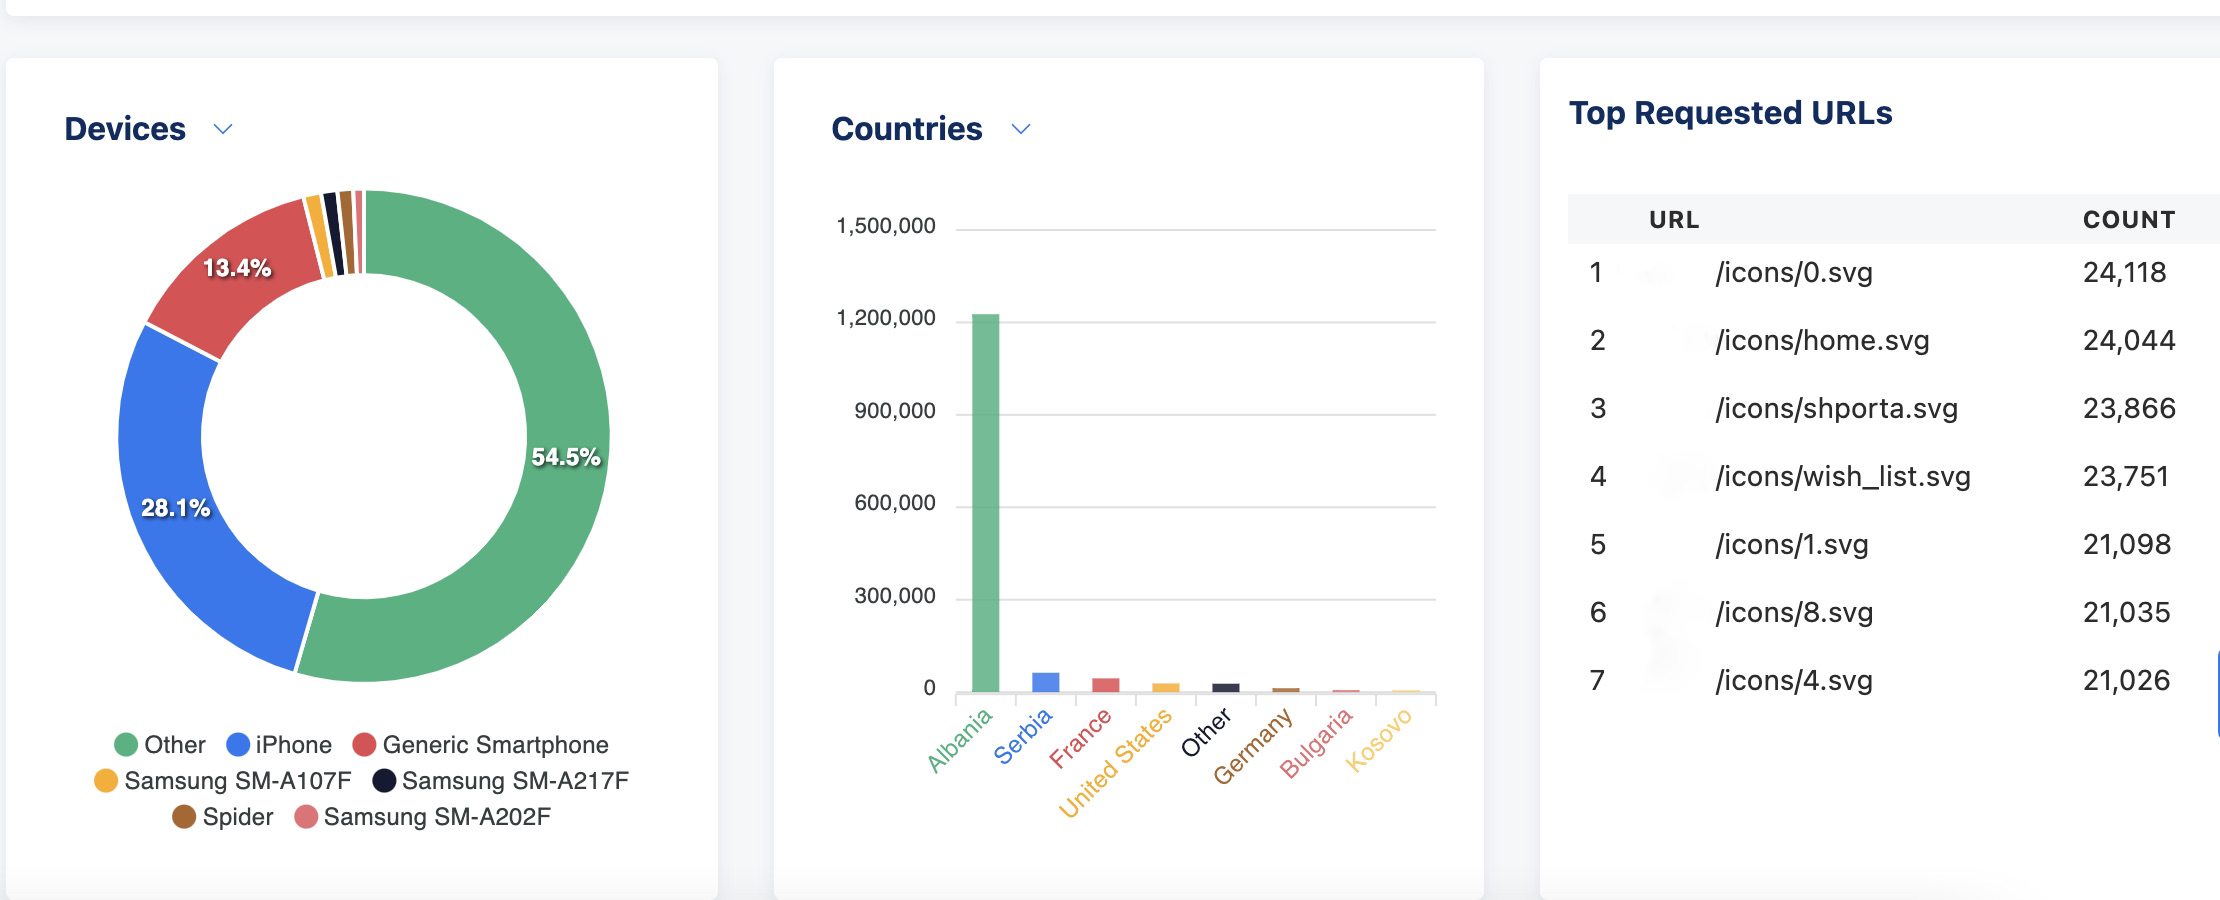
Devices - the type of the devices that your users use most frequently to access your content, for example, Desktop or Mobile.
Browsers - the name (or the name and version) of the browsers that your users use most frequently to access your content.
Operating System - the name (or the name and version) of the operating system that viewers run on most frequently when accessing your content.
Countries - the countries from which the viewers access your content most frequently.
Top Requested URLs - most popular objects for a distribution.